Data munging
So, I took some of the Atlas of North American English data which labels cities and their dialect classification. I don't think I'll look at finer grained ANAE data, like particular vowels' quality, because I don't think that would be too great with the the granularity of the data available from Senseable. I had to associate city names with counties to merge the data with the .svg, and thankfully Google Refine + Freebase was able to get me 2/3 of the way there. There are a few strange errors in the .svg file that no amount of automation was going to get around ("Orandge County, FL" Really?). I also pulled the coordinate data out of the .svg so that I could do this all in R, which is where I feel the most comfortable.For the ANAE data, I collapsed some sub-dialects together, like Inland North and North, and Inland South and South.
Mis-match Measure
So, I have counties with dialect classification, and counties with calling and sms-ing classifications. I want to come up with a way of evaluating the mis-match between these. Here's a sketch of how I did that.for D in Dialects:
for C in Calling_Communities:
Within = D ∪ C
Outside = C - D
ratiod,c = |Outside|/|Within|
So, "Within" is the set of counties that are both in dialect D and calling community C. "Outside" is the set of counties that are in calling community C and in some other dialect than D. You might have thought that I'd also include the set of counties that are in dialect D and in some other calling community than C, but that's actually not so important. As I said before, these dialect regions are rather large, so I'd expect there to be many calling communities within one dialect. What's stranger is calling communities which span dialects.
So, for interpreting the ratio, as it reaches 0 or ∞, the fit between dialects and calling communities is pretty good. At 0, a calling community is contained entirely within a dialect. As it approaches ∞, a dialect is more and more marginally part of a calling community.
Next step, I took abs(log(ratiod,c)). Now I have a measure that runs from 0 to ∞, and the closer it is to 0, the bigger the mismatch. I also wanted to boost the match score of smaller dialect regions. I forget why, but it made sense at the time. So, I weighted these absolute log-odds by 1/|D|.
Results
Here are the median results per dialect compared to calling communities, from best to worst match:- West - ∞
- St. Louis Corridor - 0.45
- Florida - 0.35
- Western New England - 0.19
- Eastern New England - 0.08
- Western PA - 0.07
- Texas - 0.06
- South - 0.03
- North - 0.02
- Midland - 0.01
- Mid-Atlantic - 0
- NYC - 0
And for the sms data:
- West - ∞
- South - ∞
- St. Louis Corridor- 0.5
- Florida - 0.34
- Eastern New England - 0.17
- Western New England - 0.15
- Western PA - 0.07
- Texas - 0.06
- Midland - 0.05
- North - 0.02
- Mid-Atlantic - 0
- NYC - 0
I'd not put so much stock into the Mid-Atlantic and NYC scores. To a large degree this is due to them cannibalizing each other, and they're not that different dialectally anyway.
What's really interesting is the poor Midland and Northern scores. While I haven't worked out a measurement for which dialects are most mixed within calling communities, I suspect their poor scores are related to each other.
Graphs!
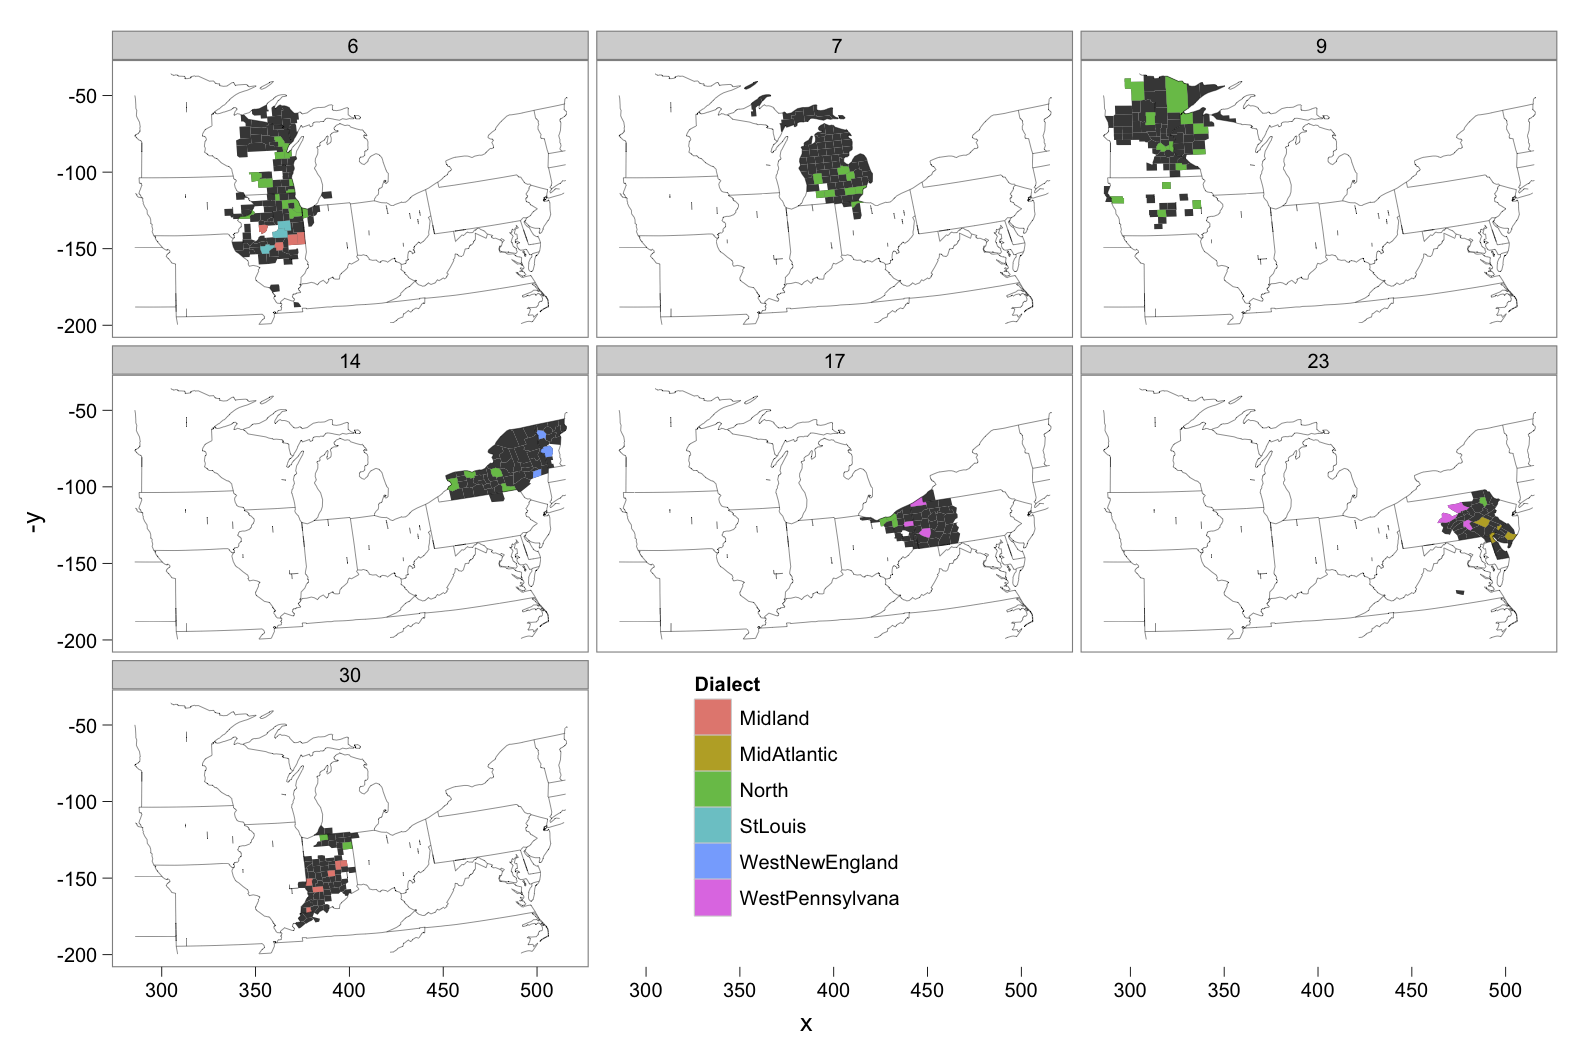
In this first graph, each facet is for a calling community in which there is a Northern dialect county. The filled in bits are the counties which are within the calling community, and the colored counties are ones we have dialect data for.
 |
| Calling data |
In 4 out of 7 calling communities in which there is a northern dialect county, there is also a Midland dialect county. That's basically along the entire border region between the two dialects.
Here's the same graph for sms-ing communities.
Here's the same graph for sms-ing communities.
 |
| SMS data |
Labov noticed years ago, with dollar bill data, that you have plenty of communication across the North-Midland boundary. This strengthens, not weakens, the classic interpretation: transmission, children, structural patterns, settlement.
ReplyDeleteYou're right, Dan. I was trying to treat the communication density hypothesis as the kind of thing a reasonable person might think.
ReplyDelete