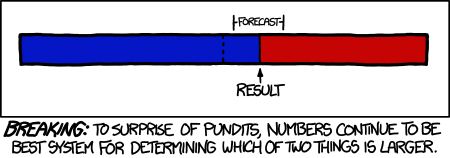
If Nate Silver told me it's going to rain marshmallows tomorrow, I'd stand outside with cups of hot chocolate.For me, as a data geek, this is nothing but good news. There's been a lot of talk about how Silver's high profile during the election could have broader effects on how every day people think about data and prediction. There's also talk about how Silver's performance is challenging to established punditry, as summed up in this XKCD comic.
— Rick Reilly (@ReillyRick) November 7, 2012
Coming at this from the other side, though, I'm curious as a data person about how much secret sauce Silver's got. Sure, in broad qualitative strokes, he got the map right. But quantitatively, Silver's model also produced more detailed estimates about voting shares by state. How accurate were those?
Well, to start out, there is not some absolute sense of accuracy. When it comes to predicting which states would go to which candidates, it's easy to say Silver's predictions were maximally accurate. But what's tricker is to figure out how many he could have gotten wrong and still have us call his prediction accurate. For example, Ohio was a really close race. If Ohio had actually gone to Romney, but all of Silver's other predictions were right, could we call that a pretty accurate prediction? Maybe. But now let's say that he got all of conventional battle ground states right, but out of nowhere, California went for Romney. It's the same situation of getting one state wrong, but in this case it's big state, and an anomalous outcome that Silver's model would have missed. Would his prediction be inaccurate in that case? What if it was Rhode Island instead? That would be equally anomalous, but would have a smaller impact on the final election result. Now let's imagine a different United States where all of the races in all of the states had razor thin margins, and Silver correctly predicted 30 out of 50. In that case, we might say it was an accurate prediction.
All of this is to say that the notion of "accuracy" is really dependent upon what you're comparing the prediction to, and what the goal of the prediction is.
So what I want to know is how much Silver's model improves his prediction over what's just immediately obvious from the available data. That is, I want to see how much closer Silver's prediction of the vote share in different states was than some other baseline prediction. For the baseline, I'll take the average of the most recent polls from that state, as handily provided by Nate Silver on the 538 site. I also need to compare both the averaging method and the 538 method to the actual outcomes, which I've copy-pasted from the NPR big board. (Note: I think they might still be updating the results there, so I might have to update this post at some future date with the final tally.)
First I'll look at the Root Mean Square Error for the simple average-of-polls prediction and the 538 prediction. I'll take Obama and Romney separately. The "Silver advantage" row is just the poll averaging prediction divided by the 538 prediction.
| Obama | Romney | |
|---|---|---|
| Averaging Polls | 3.3 | 4.1 |
| 538 | 1.8 | 1.7 |
| Silver Advantage | 1.8 | 2.4 |
So it looks like Silver has definitely got some secret sauce, effectively halving the RMSE of the stupid poll averaging prediction. I also tried out a version of the RSME weighted by the electoral votes of each state, for a more results oriented view of the accuracy. I just replaced the mean of the squared error by a weighted average of the squared error, weighted by the electoral votes of the state. The results come out basically the same.
| Obama | Romney | |
|---|---|---|
| Averaging Polls | 3.2 | 3.1 |
| 538 | 1.5 | 1.5 |
| Silver Advantage | 2.2 | 2.0 |
So what was it about the 538 forecast that made it so much better than simply averaging polls? I think these plots might help answer that. They both plot the error in the 538 forecast against the error in poll averaging.


So, Silver's model definitely outperforms simple poll watching & averaging. Which is good for him, because it means he's actually doing something to earn his keep.
You can grab the data I and R code was working with at this github repository. There's also this version of the R code on RPubs.
No comments:
Post a Comment